Mesogeos: A Daily Datacube for the Modeling and Analysis of Wildfires in the Mediterranean
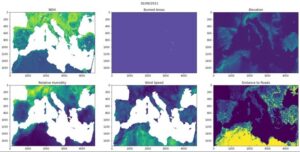
mesogeos is meant to be used to develop models for next-day fire hazard forecasting in the Mediterranean. It contains variables related to the ignition and spread of wildfire for the years 2002 to 2022 at a daily 1km x 1km grid.
Available at https://doi.org/10.5281/zenodo.7473332
More information and link for downloading the dataset can be found in https://github.com/Orion-AI-Lab/mesogeos
The dataset contains satellite data from MODIS, weather variables from ERA5-Land, soil moisture index from JRC European Drought Observatory, population count & distance to roads from worldpop.org, land cover from Copernicus Climate Change Service, elevation, aspect, slope and curvature from Copernicus EU-DEM, and burned areas and ignition points from EFFIS.
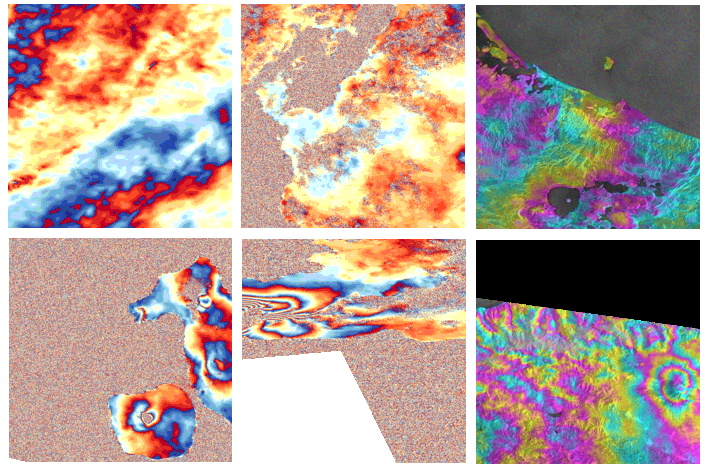
Hephaestus: A large scale multitask dataset towards InSAR understanding
![]()
Hephaestus is the first of its kind, manually annotated dataset that consists of 19,919 individual Sentinel-1 interferograms acquired over 44 different volcanoes globally, which are split into 216,106 InSAR patches. The annotated dataset is designed to address different computer vision problems, including volcano state classification, semantic segmentation of ground deformation, detection and classification of atmospheric signals in InSAR imagery, interferogram captioning, text to InSAR generation, and InSAR image quality assessment.
The code, data and models are available in the project’s GitHub repository: https://github.com/Orion-AI-Lab/Hephaestus
Hephaestus was published at the Computer Vision and Pattern Recognition (CVPR) 2022 workshop EarthVision.
You can access and download the publication here.
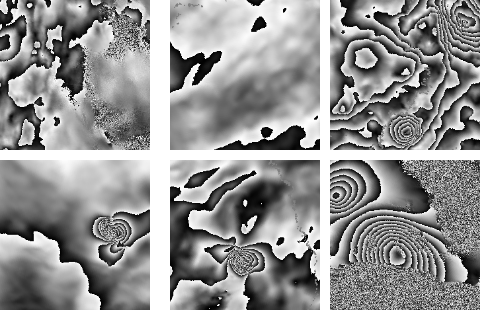
Annotated InSAR datasets for volcanic unrest detection
These datasets have been published in the context of the DeepCube Use Case on global volcanic unrest detection and alerting led by the National Observatory of Athens.
![]() To create the C1 dataset we downloaded and manually annotated InSAR products from the COMET-LiCS Sentinel-1 InSAR portal (https://comet.nerc.ac.uk/comet-lics-portal/). The S1 dataset has been provided by the University of Bristol and is part of the work of Anantrasirichai et al (https://doi.org/10.1029/2018JB015911).
To create the C1 dataset we downloaded and manually annotated InSAR products from the COMET-LiCS Sentinel-1 InSAR portal (https://comet.nerc.ac.uk/comet-lics-portal/). The S1 dataset has been provided by the University of Bristol and is part of the work of Anantrasirichai et al (https://doi.org/10.1029/2018JB015911).
To download the datasets please visit https://github.com/DeepCube-org/uc4a-notebooks
Cite our work: N. I. Bountos, I. Papoutsis, D. Michail and N. Anantrasirichai, “Self-Supervised Contrastive Learning for Volcanic Unrest Detection,” in IEEE Geoscience and Remote Sensing Letters, vol. 19, pp. 1-5, 2022, Art no. 3003905, doi: 10.1109/LGRS.2021.3104506.
Africa minicubes dataset
 The DeepCube Africa Minicubes dataset has been designed for prototyping models for forecasting drought impacts in Africa. It is an open-access dataset consisting of 50.000 spatio-temporal minicubes (13 Tb, 2017-2022). It pairs high resolution remotely sensed spectral bands with weather observations into sparsely sampled minicubes of 3.84×3.84Km.
The data is shaped into minicubes in order to facilitate the training of deep learning spatio-temporal models that make use of both spatial and temporal dependencies (convolutions and recurrency, e.g., video prediction models).
Access the dataset on Zenodo: https://doi.org/10.5281/zenodo.5079843
More information about the EarthNet initiative: https://www.earthnet.tech/en23/ds-africa/
Somalia EO data cube for drought displacement
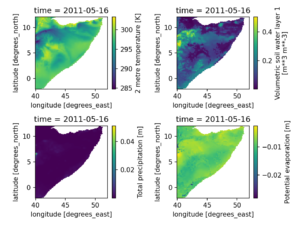 EO data cube consisting climate variables between 2010 and 2022 at 0.1 degree resolution (roughly 1 GB) over Somalia.
The data cube includes soil moisture at 4 different levels, total precipitation, 2m air temperature, potential evaporation captured from ERA5 land as well as precipitation obtained from the CHIRPS. This data cube can be served serves as the basic input resource for understanding the climate effect on drought displacement by considering various spatial and temporal aggregation levels.
We also have a tabular dataset consisting all the variables (Climate and vegetation related variables, Fatality related variables, Social economic variables, Internally Displaced Persons (IDPs)) for analyzing the climate induced migration in Africa, which can be accessed via Zenodo: https://zenodo.org/records/8141436
Data cube for the wildfire research community
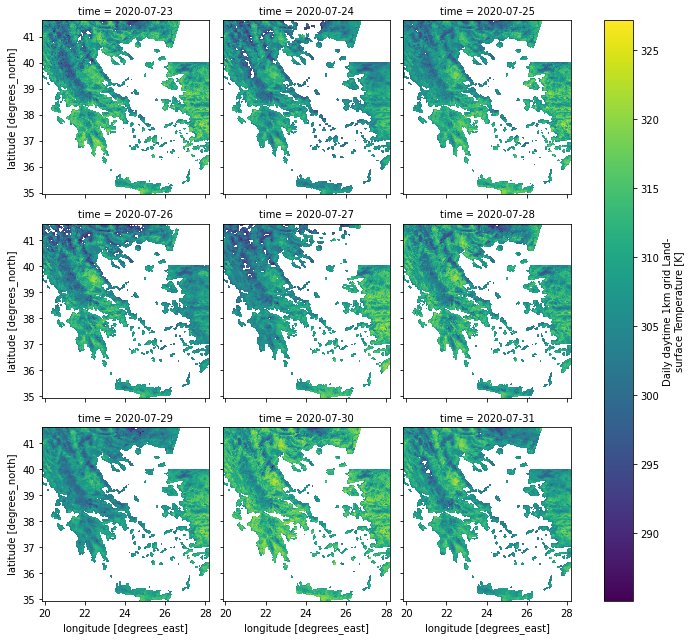
This dataset has been created by the DeepCube research team of the National Observatory of Athens and is meant to be used to develop models for next day fire hazard forecasting in Greece.
The dataset includes dynamic variables, such as previous day Leaf Area Index, evapotransiration, Land Surface Temperature, meteorological data, fire variables and Fire Weather Index, resampled at daily temporal resolution and 1km spatial resolution. It also includes static variables, such as roads density, population density and topography layers.
To download and directly access the data cube please visit http://doi.org/10.5281/zenodo.4943354
To import and analyse the data within the data cube, you can use the Jupyter Notebook we have created here.
Data cube to calculate the environmental impact of tourism in Brazil
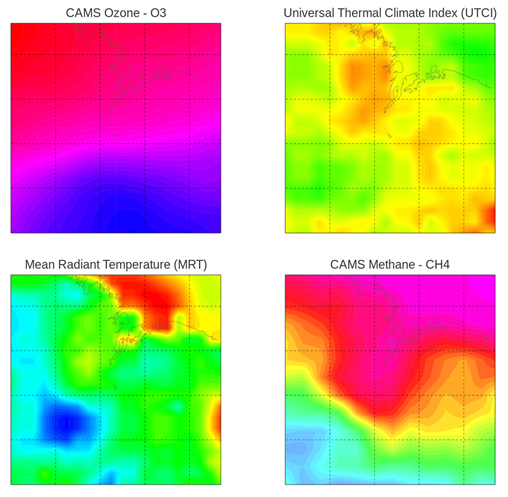
Murmuration, the greentech committed to sustainable tourism, has developed this datacube to calculate the impact of tourism activity in certain areas of Brazil.
The aim of the dataset is to use models to isolate the impact of a travel package offered by a tourism stakeholder, so that the virtual extra cost of a tourist on the local environment can be calculated.
The datacube includes dynamic variables such as the land surface temperature, the soil moisture condition, the Normalized Difference Vegetation Index, the atmospheric composition through different variables (carbon monoxide, nitrogen dioxide, zone, sulphure dioxide, etc), the thermal comfort index of the Tourism Sustainable Development Index, as well as other static variables such as topographic layers or land cover maps.
To access and download the datacube please visit https://doi.org/10.5281/zenodo.5076076
Sen4AgriNet
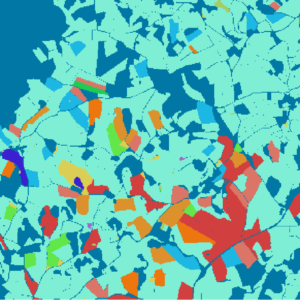 Sen4AgriNet is a Sentinel-2 based time series multi-country benchmark dataset, tailored for agricultural monitoring applications with Machine and Deep Learning. It is annotated from farmer declarations collected via the Land Parcel Identification System (LPIS) for harmonizing country wide labels. These declarations have only recently been made available as open data, allowing for the first time the labelling of satellite imagery from ground truth data. We proceed to propose and standardise a new crop type taxonomy across Europe that address Common Agriculture Policy (CAP) needs, based on the Food and Agriculture Organization (FAO) Indicative Crop Classification scheme. Sen4AgriNet is the only multi-country, multi-year dataset that includes all spectral information. The current version covers the period 2019-2020 for Catalonia and France, and it can be extended to include additional countries and/or years.
Access the dataset on GitHub: https://github.com/Orion-AI-Lab/S4A
Access the data cubes through Copernicus ONDA DIAS
To facilitate the exploitation of the data cubes produced within this task, we have uploaded the datasets to the Swift Object Store on ONDA DIAS and made them publicly available. Interested stakeholders can access the data, inspect the metadata and parts of the datasets without having to download the whole data cube. The access URLs for the use case data cubes are the following:
For drought forecasting in Africa: https://storage.de.cloud.ovh.net/v1/AUTH_84d6da8e37fe4bb5aea18902da8c1170/uc1/uc1cube.zarr
For wildfire hazard forecasting: https://storage.de.cloud.ovh.net/v1/AUTH_84d6da8e37fe4bb5aea18902da8c1170/uc3/uc3cube.zarr
For sustainable tourism: https://storage.de.cloud.ovh.net/v1/AUTH_84d6da8e37fe4bb5aea18902da8c1170/uc5/datacube_uc5.zarr
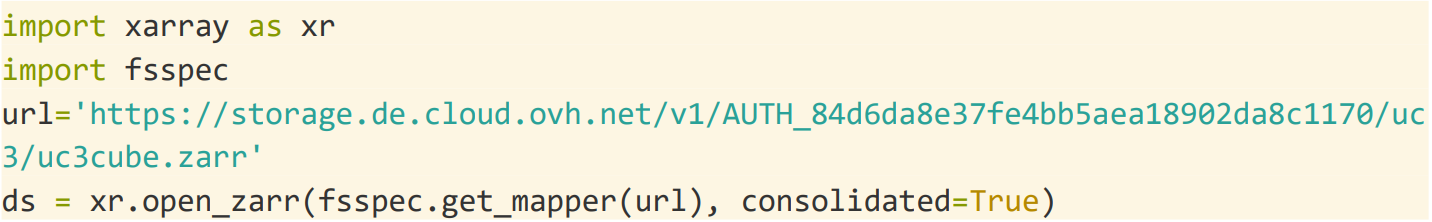
This opens the dataset and lets the user access all dataset and variable metadata, without downloading the actual data. Subsets can then be selected and distributed computations can be directly performed on the dataset using xarray and dask. Please note that the links provided above do not work as direct download links but serve as an entry point for exploration from within a programming environment like python or Julia.
For demonstration purposes we have prepared some Jupyter notebooks on how to access the data cubes, which can be found in https://github.com/meggart/DeepCubeGen/tree/main/access_examples