Visualization of EO data
For the past years, we are experiencing an increase in the variety of Earth Observation data that are becoming available as Linked Data. This leads to an increased number of non-expert users that are expected to analyze these data. Visualization techniques provide inexperienced users an intuitive way to explore and analyze Linked Data, but also assist expert users with new perspectives. The tool Sextant was developed to address the need of a web-based GIS system that could handle linked geospatial data, but also offer the ability to interact with the most common GIS formats. Sextant supports the visualization of queries using the languages GeoSPARQL and stSPARQL, and also supports the visualization of the most common GIS formats, as layers on a map. The tool also allows the creation of thematic maps by combining different layers, and stores these maps are web resources, following the RDF paradigm.
 Sextant allows the visualization of the DeepCube platform data that hold geospatial information and also the interlinking in map level with different sources to assist the use cases and create thematic maps that would be distributed as web resources. Moreover, the intuitive query builder that has been developed, utilizes the new ontologies that accompany the semantic data cube. Non-expert users can to use this feature to explore the different classes available in the data and create filters over their properties. These visualization features will assist in the creation of user interfaces for the use cases, but also allow expert and non-expert users to explore, analyze and visualize the information that will be available in the semantic data cube.
Visual query builder for EO data
Sextant is a powerful tool that can be used by both experts and non-experts to explore and visualize SPARQL endpoints. To allow non-expert users to create layers over the Semantic data cube, we developed the first version of a visual query builder that allows users to search for classes and apply filters on their properties to create new layers on the map.
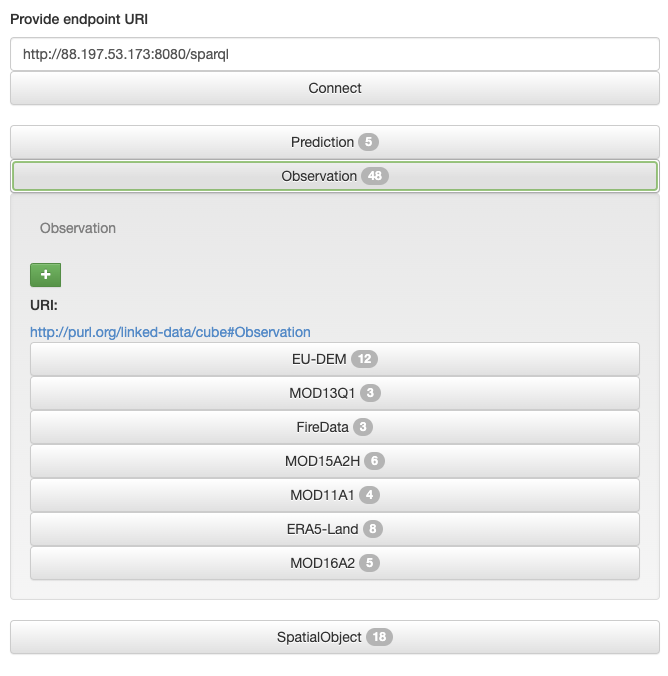
The basic functionality that assists in exploration is provided through the Explore panel menu of the User Interface. Users can provide the URL of a SPARQL endpoint, and the system returns all the classes that are available in the endpoint in a tree structure as shown in the Figure below. The system presents the underlying ontology of the endpoint to the user as a hierarchy. Each class is accompanied by a number that denotes the number of subclasses. When the user clicks on a class, it expands and reveals the URI of the class and the available subclasses.
If a class happens to have geospatial representation, Sextant detects it and allows us to create filters over the class’s properties and then visualize the results as a layer on the map. In this case, when the properties are presented by the system, the user can apply filters on them by using the “filter” buttons. There are three categories of filters available, based on the datatype of the property’s range: numeric, string, geospatial.

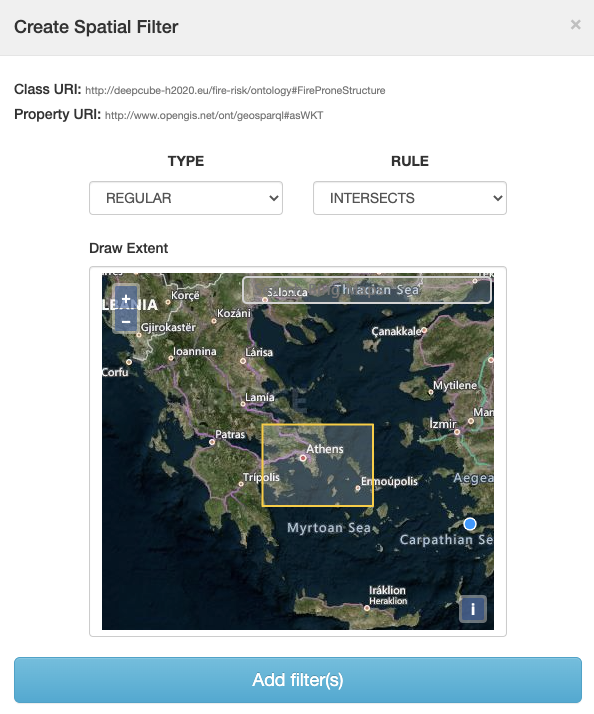
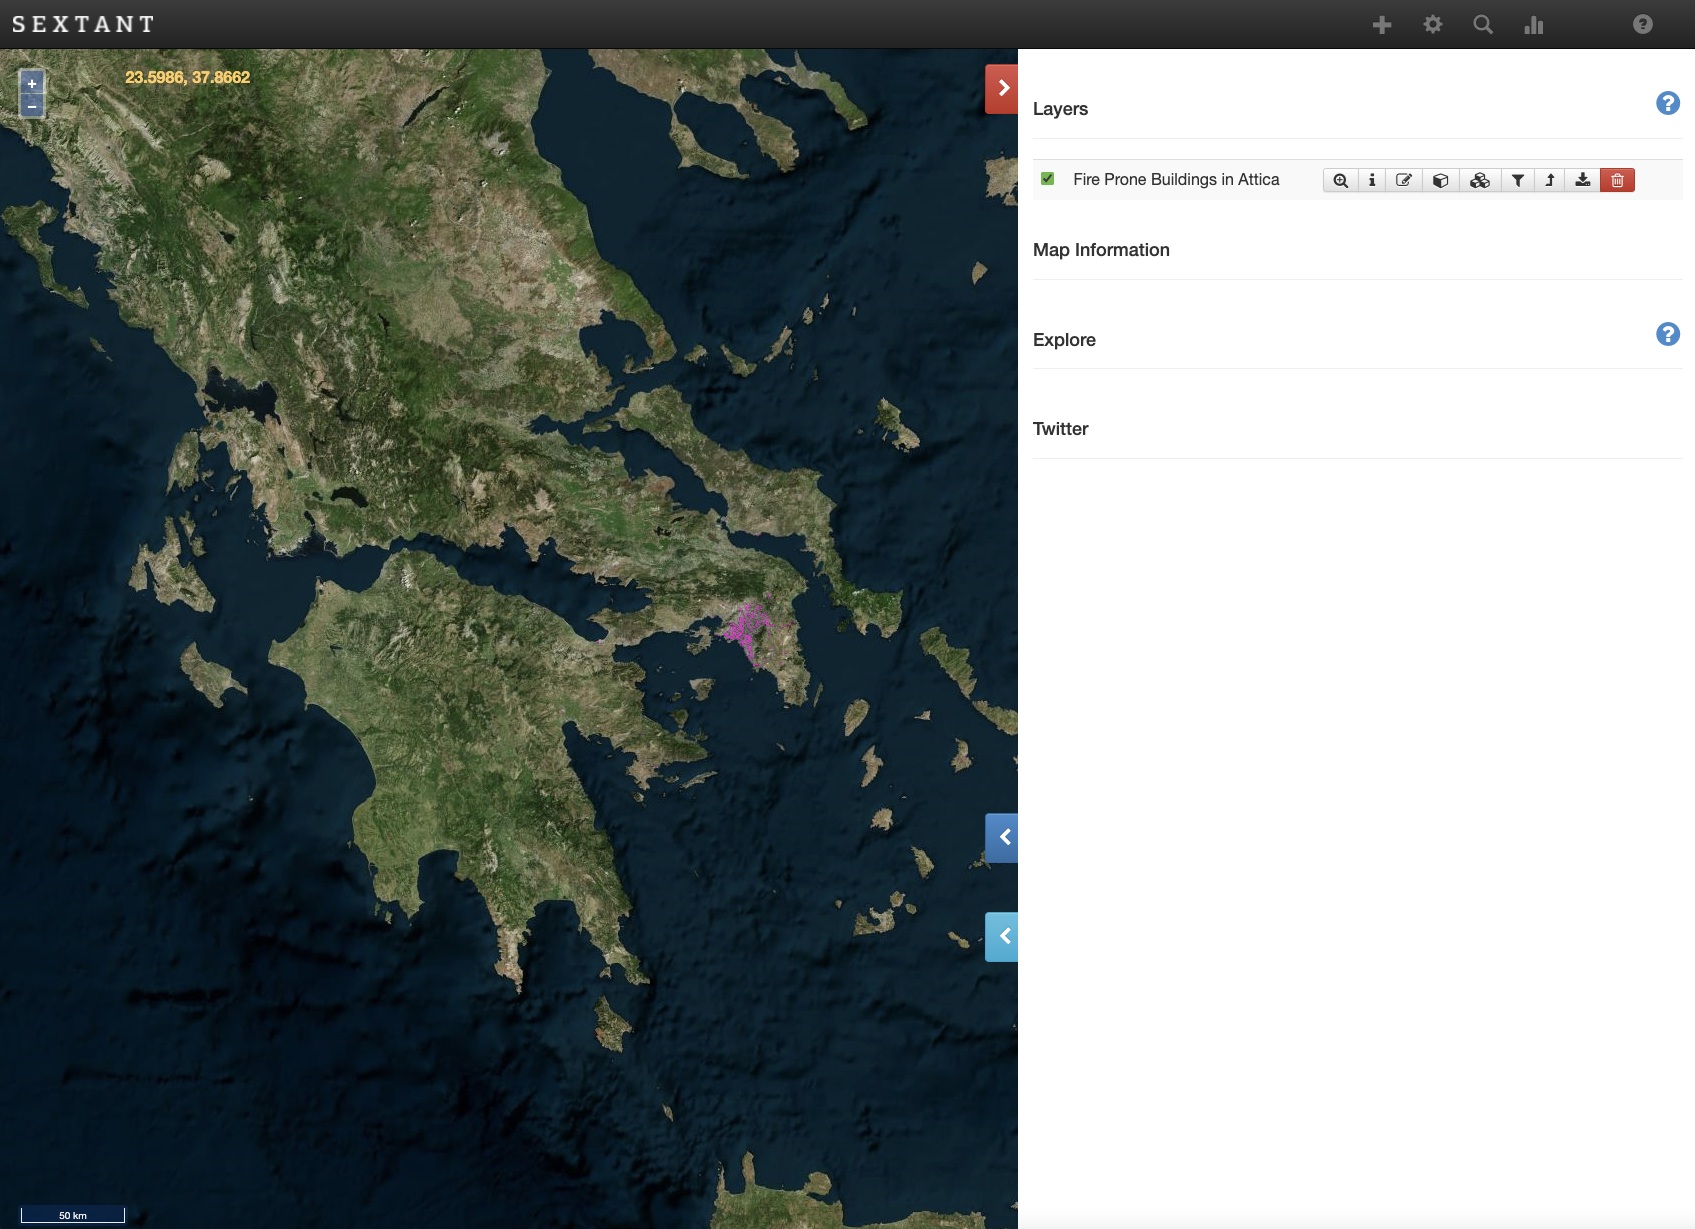
Sextant, uses all the provided filters over the class to construct a GeoSPARQL query that is then evaluated in the SPARQL endpoint and the results are visualized as a layer on the map. In this manner, the explore panel was enhanced to provide a visual query builder for non-expert users. In the Figure below we can see the layer “Fire Prone Buildings in Athens” that was created on the map.
Interested in learning more? Contact us!
Manolis Koubarakis, [email protected]
George Stamoulis, [email protected]